Statistical testing often starts with a simple question: “Are these two groups different?” Many people reach for a t-test, but that approach depends on assumptions, especially normality (and, in some versions, equal variances). In practice, real-world data can be skewed, contain outliers, or be measured on an ordinal scale (like ratings). That is where non-parametric methods help. The Mann-Whitney U test is one of the most widely used non-parametric tests for comparing two independent groups when normality is questionable. If you are learning applied statistics through data analysis courses in Hyderabad, understanding this test gives you a reliable tool for messy datasets.
Why Non-parametric Tests Matter in Real Data
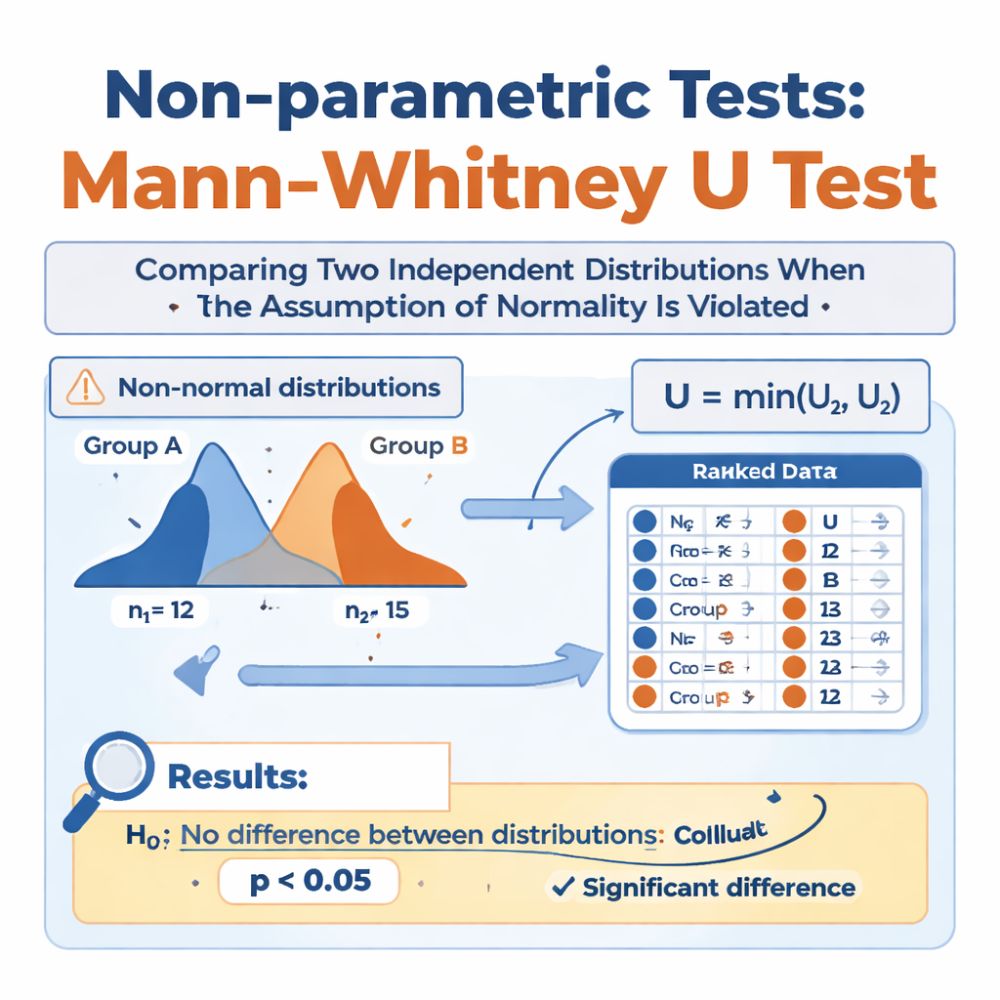
Non-parametric tests are designed to work without requiring the population to follow a specific distribution (like a normal distribution). This makes them useful when:
- Your sample is small and normality checks are inconclusive.
- The data is heavily skewed (e.g., time-to-complete tasks, income, waiting times).
- Outliers are present and meaningful rather than “bad data.”
- The measurement scale is ordinal (e.g., 1–5 satisfaction scores).
Instead of relying on means and standard deviations, many non-parametric tests focus on ranks. Ranking reduces the influence of extreme values and makes the method more robust. However, “non-parametric” does not mean “assumption-free.” The assumptions are different, and you still need to respect them.
What the Mann-Whitney U Test Actually Tests
The Mann-Whitney U test (also called the Wilcoxon rank-sum test) compares two independent groups. Independence means each observation belongs to one group only, and one person’s value does not affect another’s.
What is the null hypothesis?
The null hypothesis is that the two groups come from the same distribution. In many practical interpretations, especially when the distributions have similar shapes, it is often described as testing whether one group tends to have larger values than the other (a “shift” in typical values).
When it’s a good choice
Use Mann-Whitney U when:
- You have two independent groups (e.g., Group A vs Group B).
- The outcome is continuous or ordinal.
- Normality is doubtful, or you prefer a rank-based test.
A typical example: comparing customer satisfaction ratings (1–5) between users of two product versions. Another example: comparing defect resolution times between two support teams where times are skewed and contain long delays.
Learners in data analysis courses in Hyderabad often see Mann-Whitney U used in A/B testing scenarios when the metric is not nicely bell-shaped.
How the Test Works (Intuition and Steps)
At a high level, Mann-Whitney U converts the combined data from both groups into ranks, then checks whether the ranks from one group are consistently higher (or lower) than the other.
Step-by-step outline
- Combine both groups’ observations into a single list.
- Rank all observations from smallest to largest.
- Sum the ranks for each group.
- Compute the U statistic, which reflects how often values in one group precede values in the other group in the ranking.
- Convert U into a p-value (exact methods for small samples; normal approximation for larger samples).
Key assumptions to remember
- Independence: no pairing or repeated measurements across groups.
- Ordinal/continuous outcome: ranks must be meaningful.
- Similar distribution shapes (if your goal is a “difference in medians” interpretation). If shapes differ greatly, the test may detect distribution differences, but interpreting it purely as a median shift can be misleading.
- Handling ties: ties are allowed, but many ties reduce information and should be handled correctly by software.
Reporting Results Properly (Beyond “p < 0.05”)
A good analysis does not stop at a p-value. You should also communicate the magnitude and direction of the difference.
What to report
- The median (or other robust summary) for each group.
- The U statistic, sample sizes, and p-value.
- An effect size measure.
Common effect size options include:
- Rank-biserial correlation (interpretable as how strongly group membership relates to higher ranks).
- Cliff’s delta (probability-based measure of dominance between groups).
Practical example (conceptual)
Suppose you compare the “time to first response” (minutes) for two independent support processes. The distribution is skewed because some tickets wait a long time. Mann-Whitney U is appropriate because it focuses on rank ordering rather than assuming a normal mean-based comparison. If the p-value is low and the effect size indicates meaningful separation, you can confidently say one process tends to respond faster, even if the data has long tails.
This type of thinking is exactly what employers expect from candidates coming out of data analysis courses in Hyderabad: choose the test that fits the data, then interpret it responsibly.
Common Mistakes and Better Alternatives When Needed
- Using it for paired data: If the same users are measured twice (before/after), use the Wilcoxon signed-rank test, not Mann-Whitney U.
- Ignoring distribution shape differences: If one group is much more spread out, the test may be picking up dispersion differences, not just a shift in “typical” value.
- Treating it as “always a median test”: That interpretation holds best when the group distributions have similar shapes.
- Not visualising the data: Always inspect boxplots, violin plots, or ECDFs to understand what the test result means.
If you need to compare more than two independent groups, consider the Kruskal–Wallis test (a generalisation of rank-based comparison).
Conclusion
The Mann-Whitney U test is a dependable option for comparing two independent groups when normality is violated, the data is skewed, or the outcome is ordinal. It works by ranking combined observations and evaluating whether one group tends to produce higher ranks than the other. Used correctly and reported with medians and effect sizes, it offers robust, practical insight without forcing unrealistic distribution assumptions. For anyone building statistical judgement through data analysis courses in Hyderabad, mastering Mann-Whitney U is a strong step toward making analyses that match real-world data rather than idealised textbook datasets.